📄 Document Analytics
Document Analytics shows you exactly how a single document is being received — page by page, link by link, and visitor by visitor. Open it from a document's Analytics action in the Documents grid, or from a link's Analytics button on the Shared Links page.
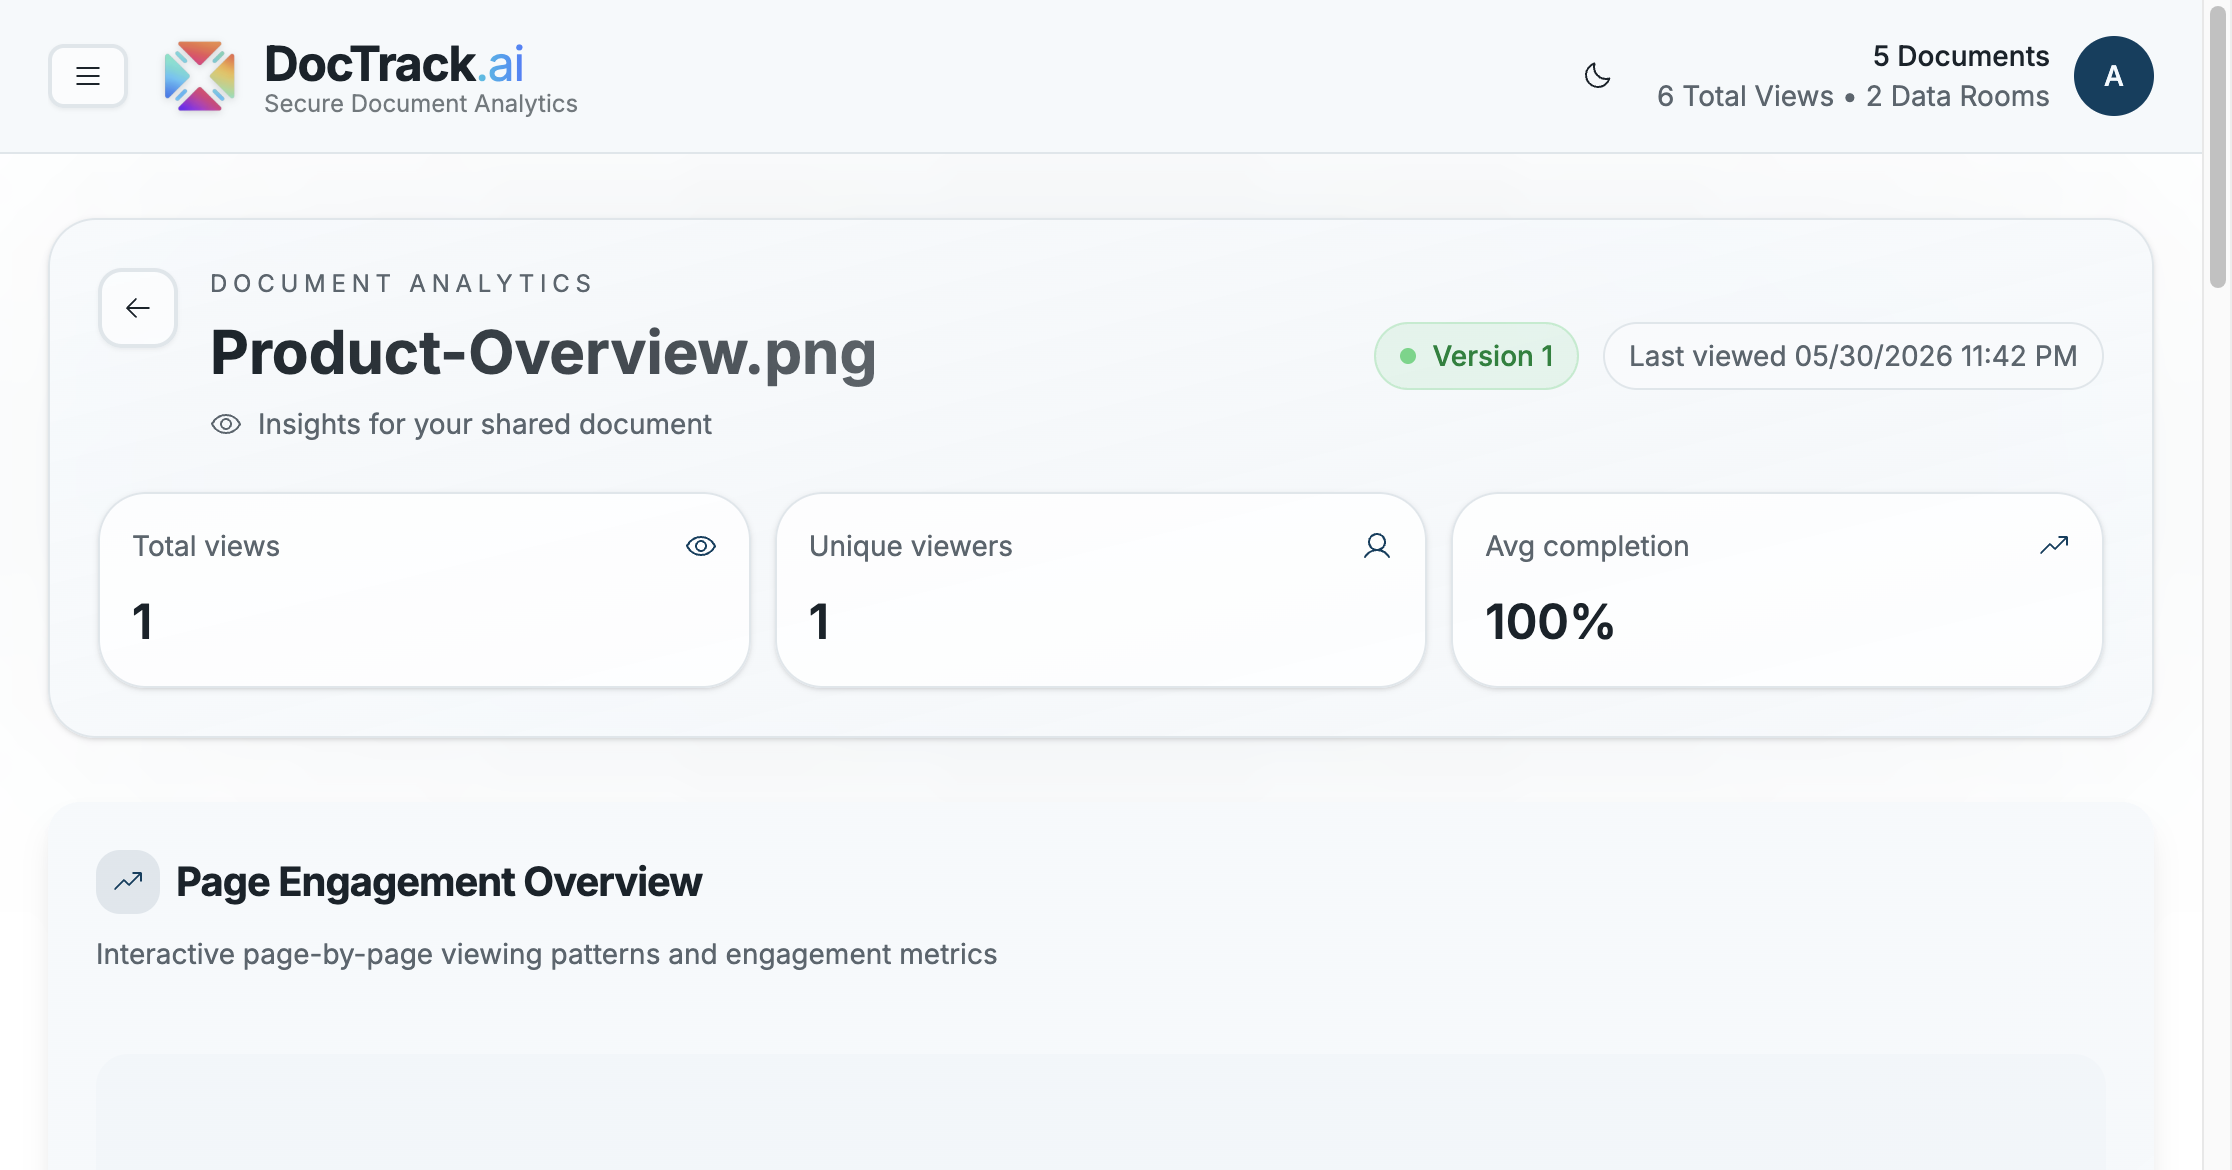
📊 Headline Metrics
At the top of the report:
| Metric | Meaning |
|---|---|
| 👁️ Total views | How many times the document has been opened. |
| 🙋 Unique viewers | The number of distinct people who viewed it. |
| ✅ Avg completion | The average proportion of the document that was read. |
The header also shows the document's version and last viewed timestamp.
📈 Page Engagement Overview
The Page Engagement Overview reveals interactive, page-by-page viewing patterns so you can see which pages hold attention and which get skipped.
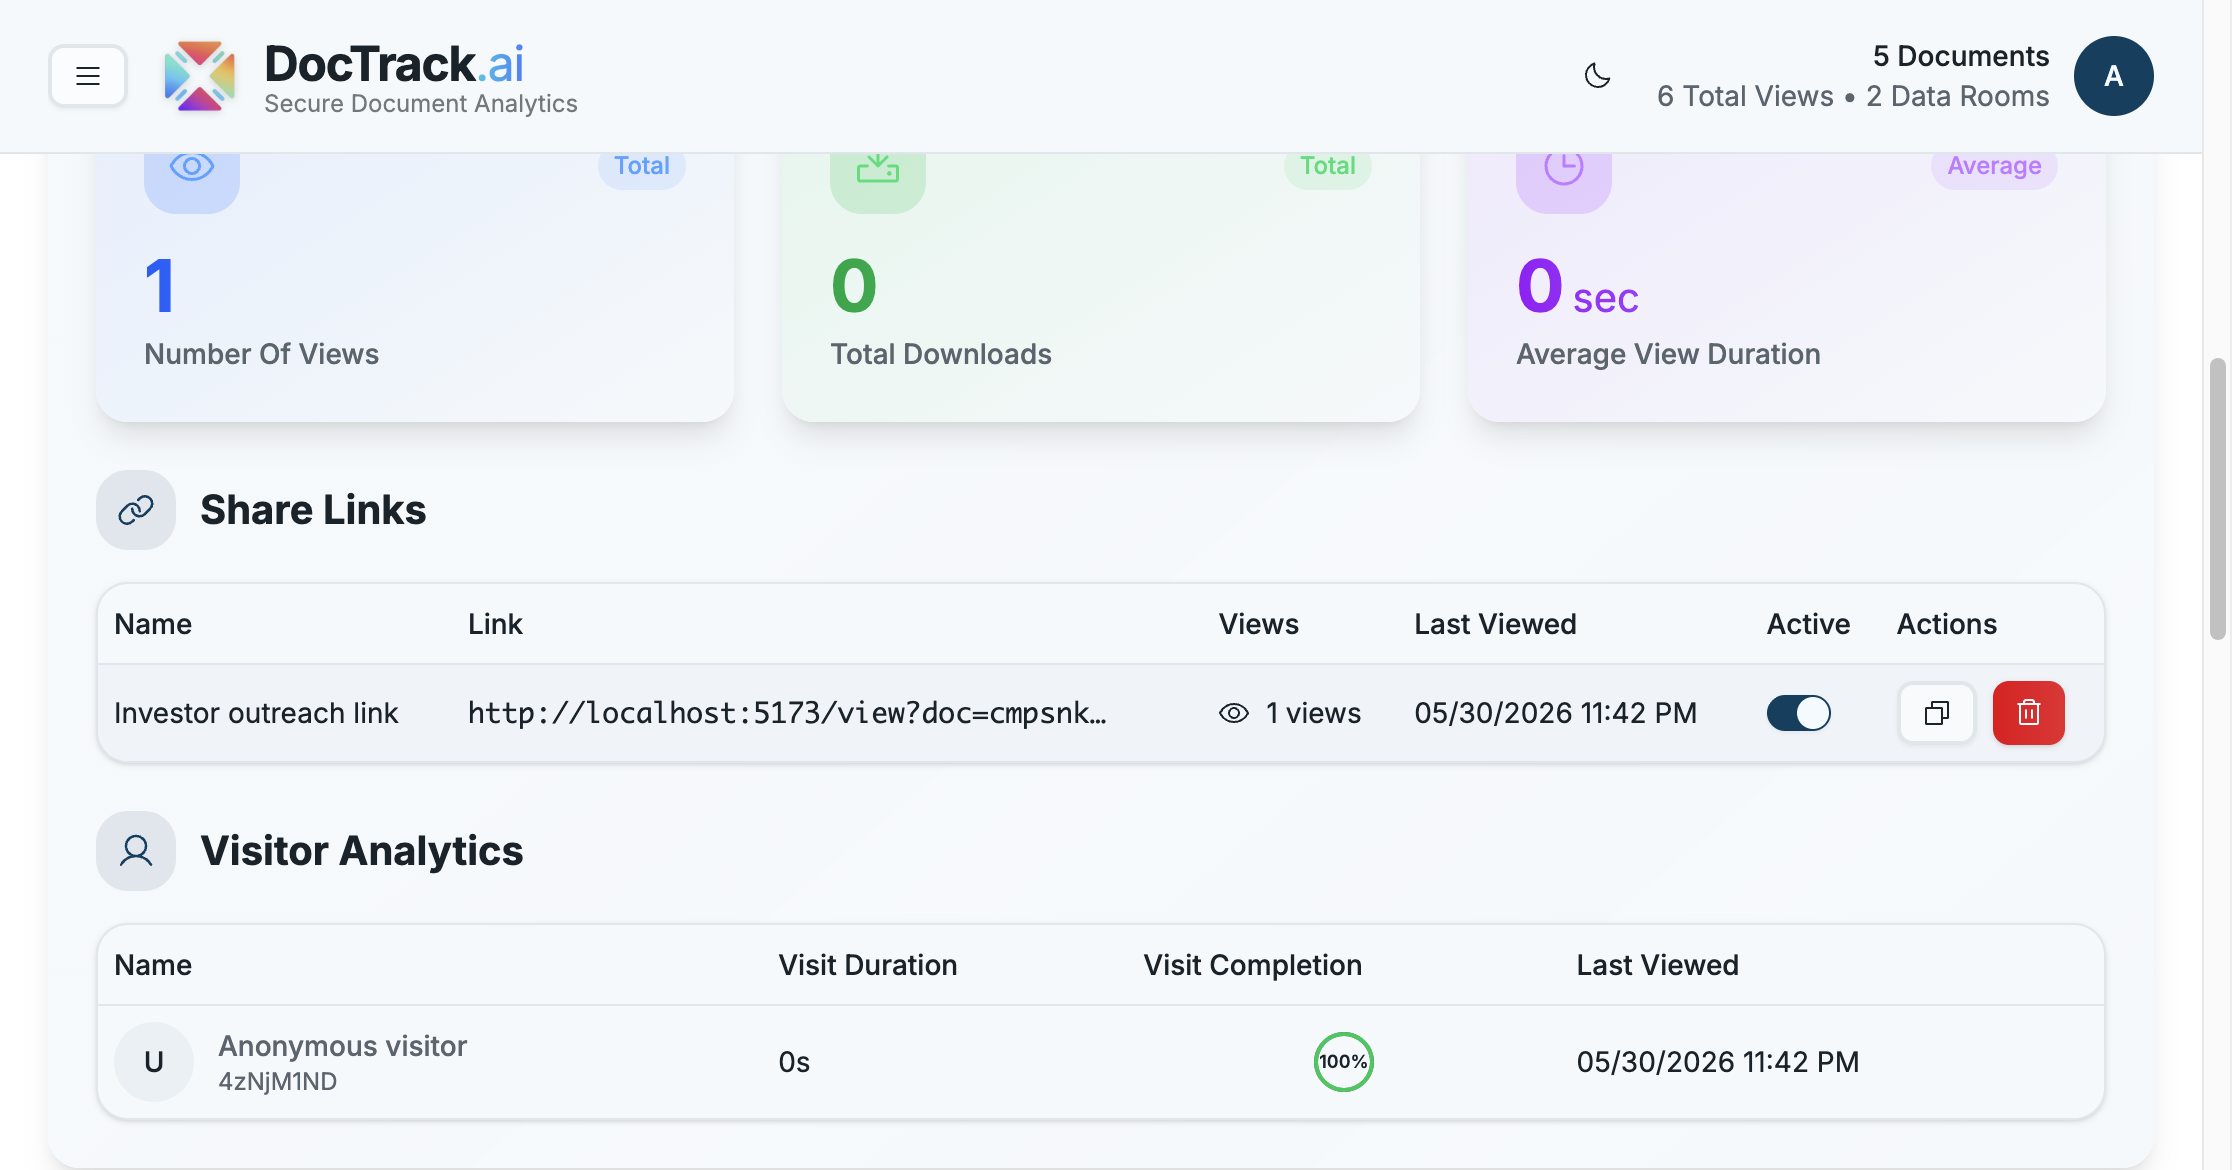
Supporting cards summarize:
- 👁️ Number of Views
- 📥 Total Downloads
- ⏱️ Average View Duration
💡 Page-level engagement is ideal for refining pitch decks and proposals — if viewers consistently drop off on a particular page, that's a signal to revise it.
🔗 Share Links Table
Below the engagement charts, the Share Links table lists every link for this document, with each link's name, URL, view count, last-viewed date, active status, and quick copy / delete actions. This lets you compare how different links (and audiences) are performing.
🙋 Visitor Analytics
The Visitor Analytics table breaks down individual sessions, showing each visitor's:
- 🏷️ Name (or Anonymous visitor with a session ID when email isn't captured)
- ⏱️ Visit duration
- ✅ Visit completion percentage
- 🕒 Last viewed timestamp
💡 Require email on a share link to replace Anonymous visitor entries with real identities.
For analytics across a whole data room, see Data Room Analytics. 🚀