📊 Analytics Dashboard
The Analytics dashboard gives you a bird's-eye view of how all your documents are performing. It's the fastest way to understand overall engagement and spot your most-viewed content.
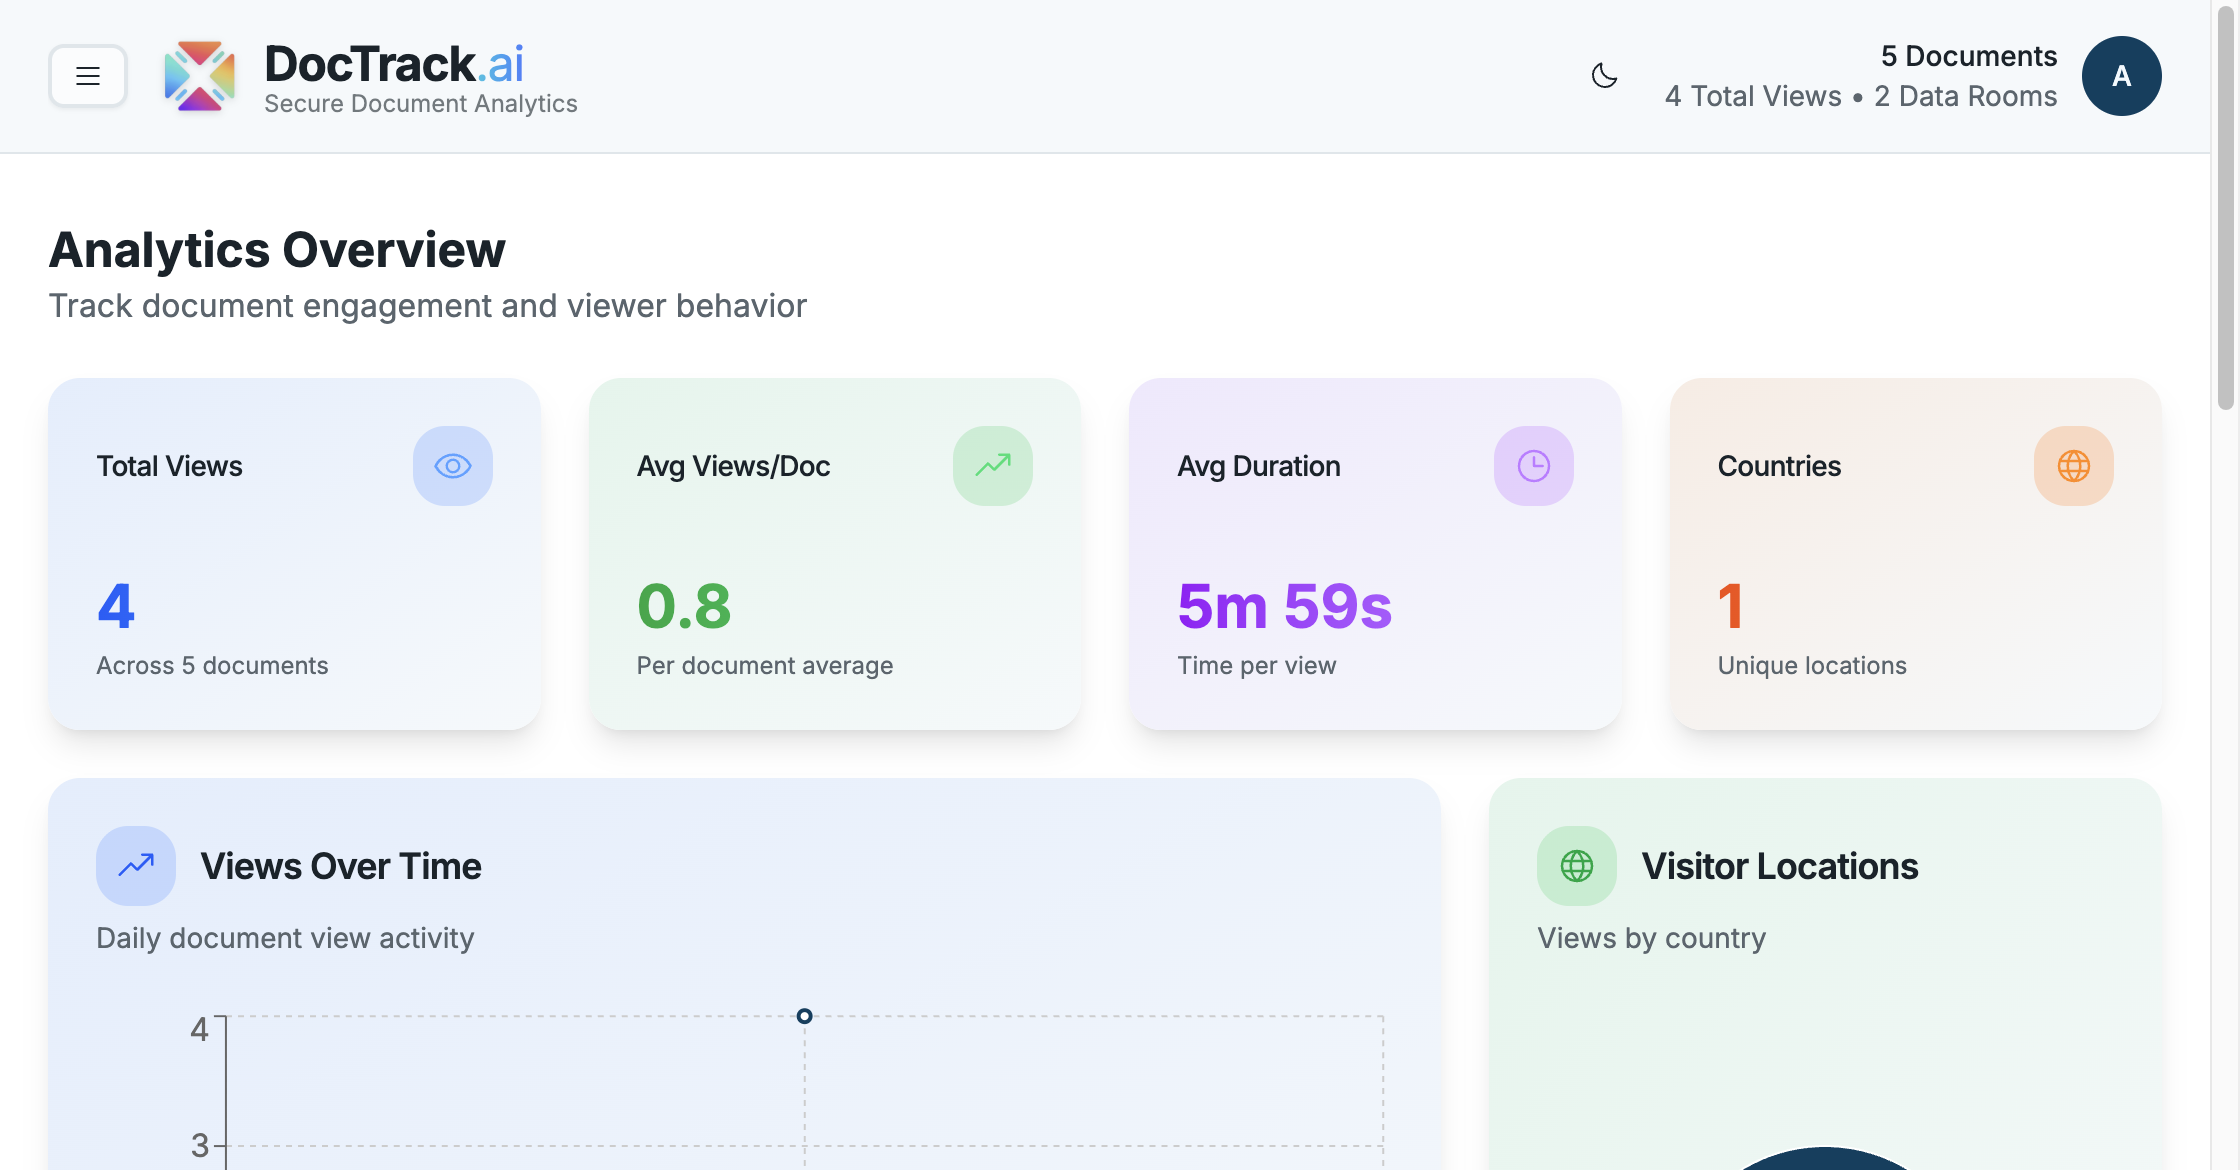
📈 Headline Metrics
At the top of the dashboard you'll find your key numbers:
| Metric | Meaning |
|---|---|
| 👁️ Total Views | The combined number of views across all your documents. |
| 📄 Avg Views / Doc | Average number of views per document. |
| ⏱️ Avg Duration | Average time viewers spend reading. |
| 🌍 Countries | How many distinct countries your viewers came from. |
📉 Charts & Breakdowns
The dashboard visualizes engagement across several panels:
- 📈 Views Over Time — a trend chart of views across a chosen period.
- 🌍 Visitor Locations — where in the world your documents are being opened.
- 🏆 Top Documents — your most-viewed files, ranked.
- 📍 Top Locations — the regions driving the most engagement.
- 🕒 Recent Activity — a timeline of the latest views and interactions.
🧭 Using the Dashboard
- Use Top Documents to identify which content resonates most.
- Watch Views Over Time to gauge the impact of an outreach campaign.
- Check Visitor Locations to understand your audience's geography.
💡 Analytics are retained according to your account's retention policy (configurable in Settings). Export important data before it ages out.
For document-level detail, continue to Document Analytics. 🚀